Understanding Correlation: Definition, Types, and Applications
Table of Content:
- In statistics, correlation refers to the measure of the strength and direction of the relationship between two or more variables. It is used to determine how changes in one variable are associated with changes in another variable.
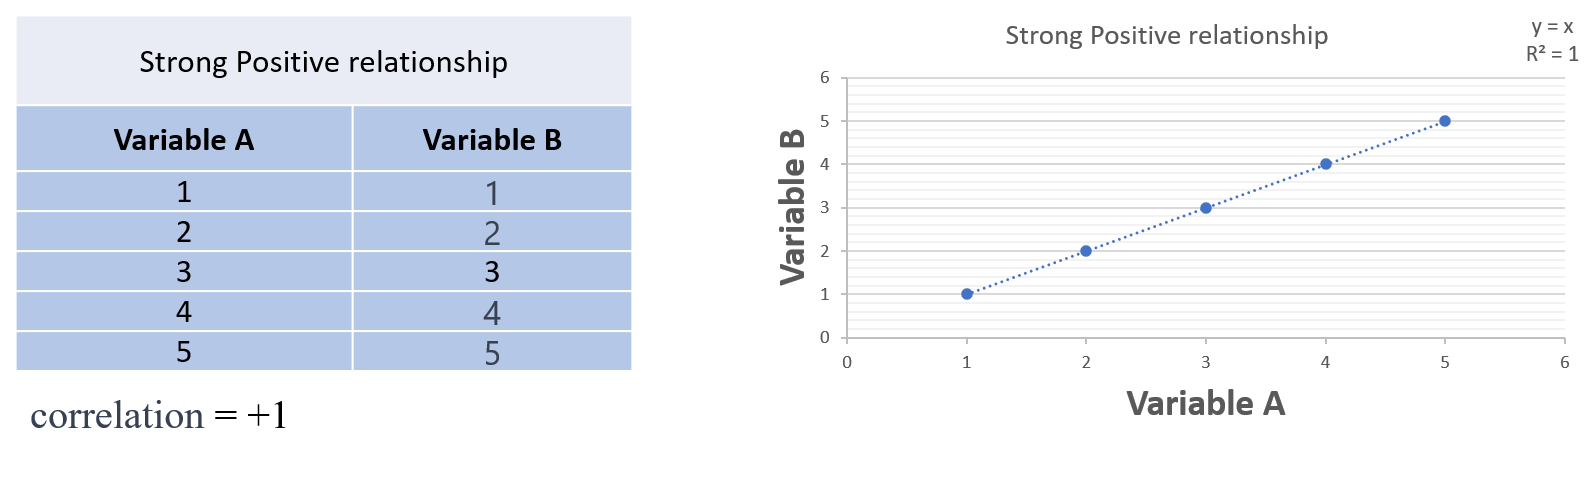
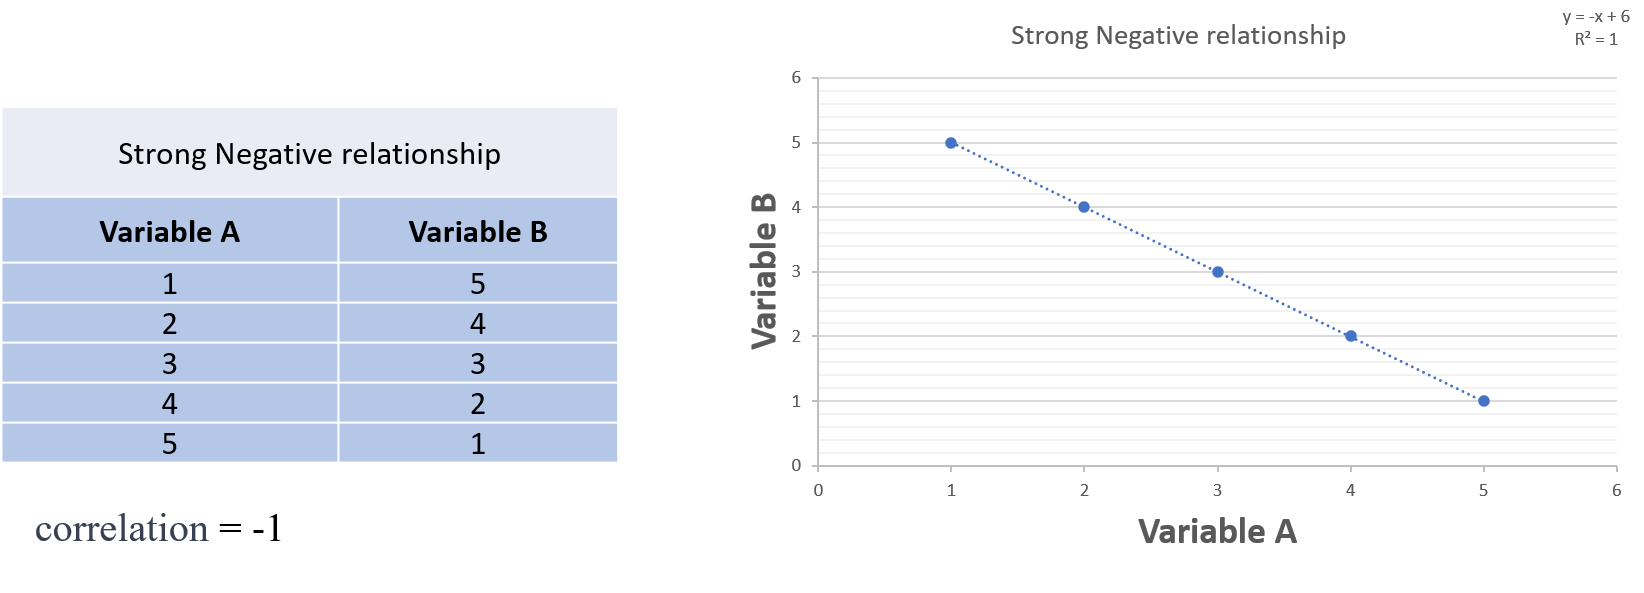
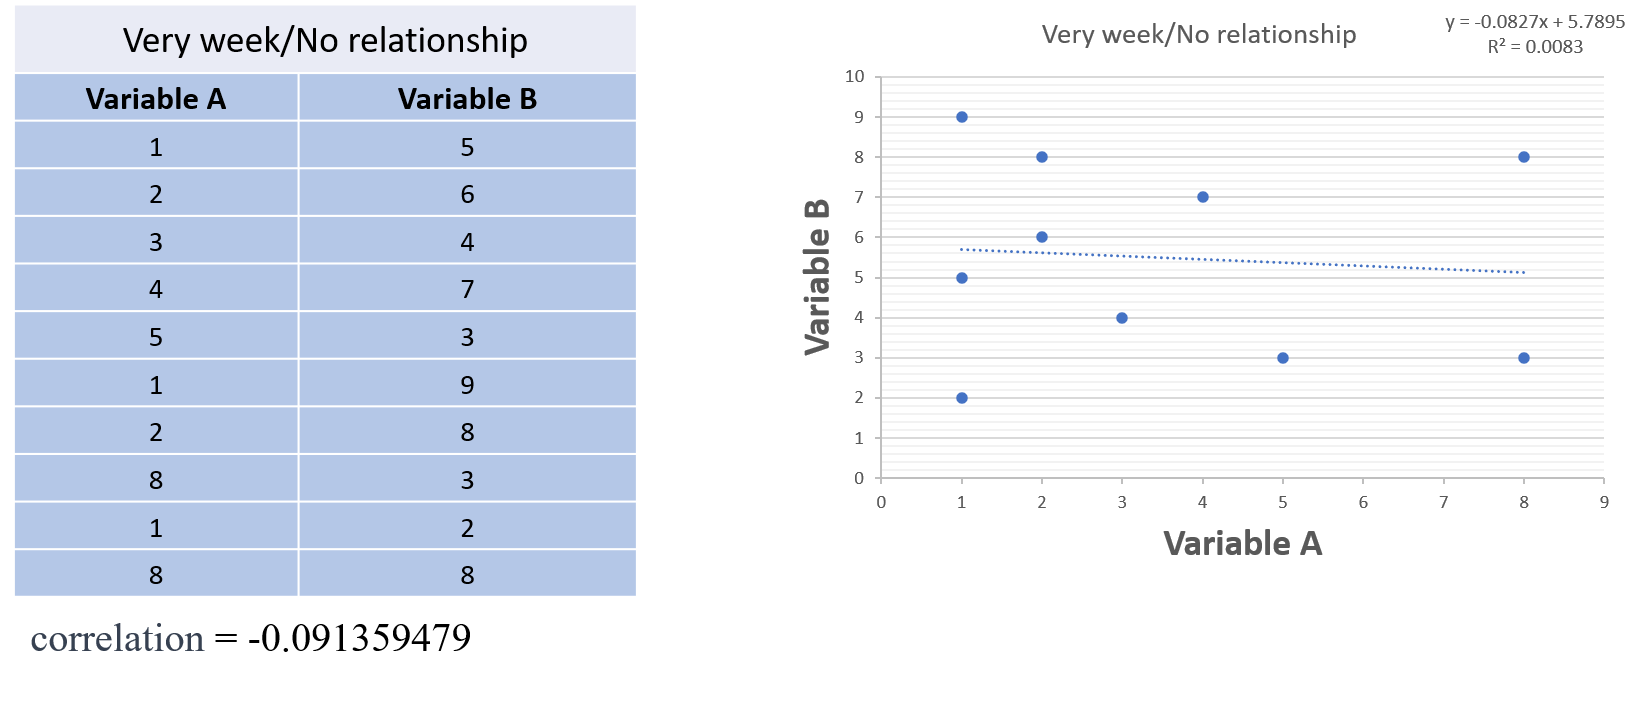
- Correlation can be positive, negative, or zero. A positive correlation indicates that as one variable increases, the other variable also increases. A negative correlation indicates that as one variable increases, the other variable decreases. A zero correlation indicates that there is no relationship between the variables.
- Correlation can be measured using various methods such as Pearson's correlation coefficient, Spearman's rank correlation coefficient, and Kendall's tau coefficient. These methods provide a numerical value that represents the strength and direction of the correlation between variables.
The formula for the Pearson correlation coefficient as follows:
$$ r = \frac{\sum_{i=1}^n (x_i - \bar{x})(y_i - \bar{y})}{\sqrt{\sum_{i=1}^n (x_i - \bar{x})^2}\sqrt{\sum_{i=1}^n (y_i - \bar{y})^2}} $$
where:
- \(r\) is the Pearson correlation coefficient
- \(n\) is the number of observations
- \(x_i\) and \(y_i\) are the values of the two variables for the \(i\)th observation
- \(\bar{x}\) and \(\bar{y}\) are the sample means of the two variables
There are different types of correlation coefficients that can be used to measure the relationship between two variables, including:
-
Pearson correlation coefficient: This is the most commonly used measure of correlation, and it assesses the linear relationship between two variables. It ranges from -1 to 1, where -1 indicates a perfect negative correlation, 0 indicates no correlation, and 1 indicates a perfect positive correlation.
-
Spearman's rank correlation coefficient: This is a non-parametric measure of correlation that assesses the monotonic relationship between two variables. It is useful when the variables are not normally distributed or when there are outliers in the data. It ranges from -1 to 1, where -1 indicates a perfect negative monotonic correlation, 0 indicates no monotonic correlation, and 1 indicates a perfect positive monotonic correlation.
-
Kendall's tau correlation coefficient: This is another non-parametric measure of correlation that assesses the monotonic relationship between two variables. It is similar to Spearman's rank correlation coefficient but it takes into account the number of ties in the data. It ranges from -1 to 1, where -1 indicates a perfect negative monotonic correlation, 0 indicates no monotonic correlation, and 1 indicates a perfect positive monotonic correlation.
-
Point-biserial correlation coefficient: This measures the correlation between a continuous variable and a binary variable.
-
Biserial correlation coefficient: This measures the correlation between two variables, where one variable is continuous and the other variable is dichotomous.
-
Phi coefficient: This measures the correlation between two dichotomous variables.
The choice of which correlation coefficient to use depends on the type of data being analyzed and the research question being addressed.